A new kind of Chart Pack
PhRMA's Chart Pack visually demonstrate how much value America’s biopharmaceutical researchers and manufacturers bring to our nation’s broader economy and policy environment.

A new kind of Chart Pack.
PhRMA's Chart Pack visually demonstrate how much value America’s biopharmaceutical researchers and manufacturers bring to our nation’s broader economy and policy environment.
A new kind of Chart Pack.
I’m excited to introduce our new online Chart Pack, a resource designed to visually demonstrate how much value America’s biopharmaceutical researchers and manufacturers bring to our nation’s broader economy and policy environment.
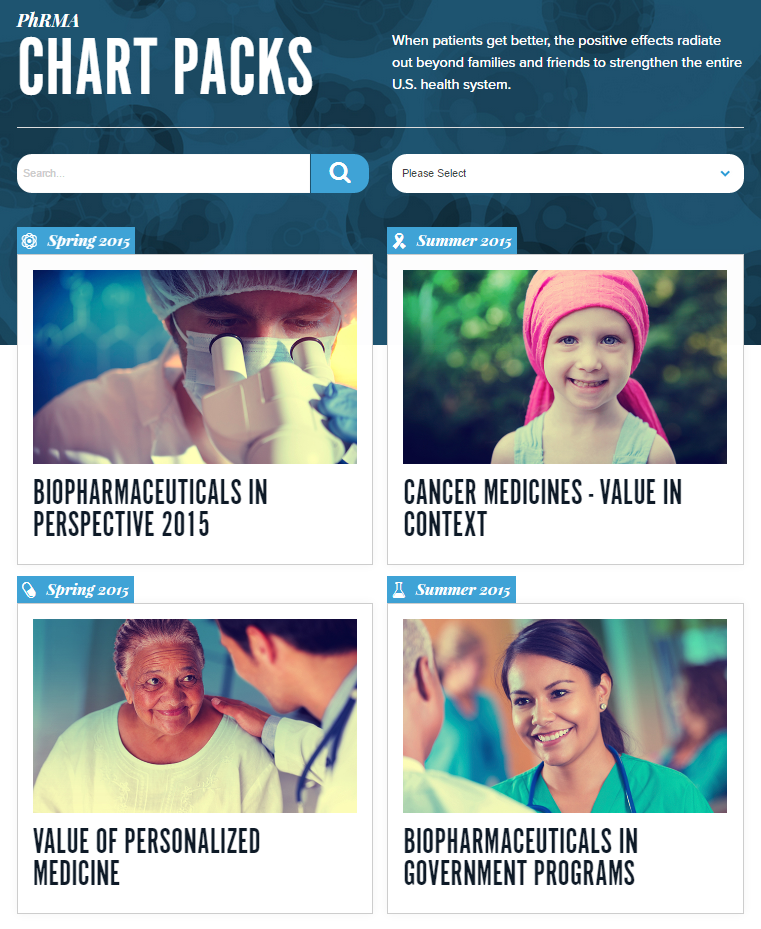
PhRMA’s chart pack reports are shareable decks of graphs and charts that highlight advances in R&D and treatment, spending and economic data, and broad outcomes and savings for different parts of the health care sphere. Our new tool houses these reports in a dynamic and easy-to-navigate platform, divided into four key areas:
This chart pack provides facts and figures about the critical role medicines play in our health care system. Our most comprehensive report, it include a broad look at: impact on health and quality of life; the drug discovery and development process; spending and costs; and industry challenges and contributions.
This chart pack helps explain the power and promise of personalized medicine, an emerging field that uses diagnostic tools to identify specific biological markers to help assess which medical treatments and procedures will be best for each patient
This chart pack features key facts about prescription medicines in four major government programs -- Medicare, Medicaid, the US Department of Veterans Affairs (VA), and the 340B program.
This chart pack takes a closer look at the role of innovative treatments in the fight against cancer. Data and information in this report comes from a wide range of sources, including government agency reports, peer‐reviewed journals, and PhRMA’s own research and analysis.
Whether sharing economic data in a meeting, discussing advances in research and development in the classroom, or simply trying to understand the many moving parts of the biopharmaceutical ecosystem, we hope that you find these reports to be a valuable and useful resource.
Please share the Chart Pack platform with your network, and stay tuned for updates and additions!