 Richard I. Smith is principal, RIS Consulting and a past executive vice president for policy and research of PhRMA.
A few weeks ago, we looked at the Medicare Payment Advisory Commission’s (MedPAC) discussion about drug spending in Medicare and provided some important additional context.
Today and tomorrow in our two-part post, we’ll add further context to the information from MedPAC. We’ll be talking about three topics:
- How has the share of Medicare spending on drugs changed between 2007 and 2013?
- Why is the share of spending on drugs different in Medicare than in the overall National Health Expenditures?
- What is actually included in Medicare spending on drugs?
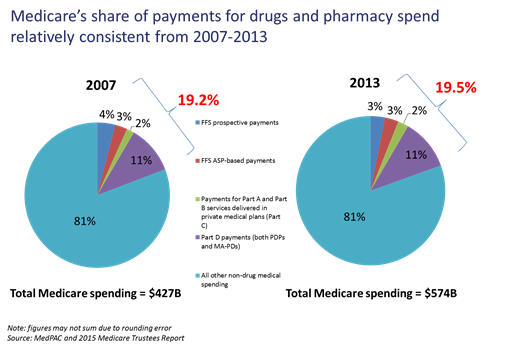
How has the share of Medicare spending on drugs changed between 2007 and 2013?
At its September meeting, MedPAC presented information about the well-known fact that not all drug spending is captured in Medicare Part D. Part D mostly covers drugs dispensed through retail pharmacies. Other drugs, covered by Medicare Parts A, B and C, are dispensed in facilities, such as hospitals, nursing facilities and physician’s offices.
Similar points have been covered in previous analysis. Two papers from the Altarum Institute in 2014 estimated the retail and nonretail prescription drug share of National Health Expenditures (NHE) from 2008 through 2023. Notably, they concluded it will remain flat over this time frame.
MedPAC’s presentation focused on 2013, not trends over time. But a closer look at data in the presentation helps us understand trends between 2007, the first full year after Part D was implemented, and 2013. Dividing MedPAC’s estimate of all Medicare drug spending by the Medicare Trustees’ determination of total Medicare spending in each year, we find between 2007 and 2013 drugs’ share of total Medicare spending was nearly the same– 19.2 percent in 2007 and 19.5 percent in 2013.
 Using the same data points, we find $117 billion out of $147 billion, or 79.6 percent, of total growth in Medicare spending between 2007 and 2013 was on services other than drugs. These comparisons aren’t included in MedPAC’s presentation, but should be used to help put the presentation’s findings in context.
Also not included in the MedPAC presentation is any discussion of how medicines used by Medicare patients changed as drugs’ share of spending remained nearly constant. Just a few of the treatment advances reaching patients over this period include a new class of medicines to treat high blood pressure, the first lupus drug in 50 years, a new oral treatment for multiple sclerosis, and increased use of targeted therapies .
Tomorrow we’ll dig further into the difference between Medicare spending and National Health Expenditures and what is actually included in some of these numbers.