 Richard I. Smith is principal, RIS Consulting and a past executive vice president for policy and research of PhRMA.
Yesterday, we looked at MedPAC’s recent presentation on drug spending in Medicare. We found that a close look at the data reveals that prescription medicines’ share of Medicare spending was nearly the same in 2007 and 2013 even as many important advances in medicines reached patients, and four out of every five dollars of increased Medicare spending over this period went to items and services other than prescription medicines. Today we’ll dig even further.
Why is the share of spending on drugs different in Medicare than in the overall National Health Expenditures?
MedPAC contrasts retail drug spending in Medicare (13 percent) and overall National Health Expenditures (9 percent). This naturally raises questions about why the numbers are different and whether that difference has policy significance. The answer shows that this data point isn’t particularly meaningful.
The National Health Expenditures (NHE) and Medicare spending compared in the MedPAC presentation is not an apples to apples comparison. Simply put, Medicare is designed to fund only a subset of the services included in NHE. For example:
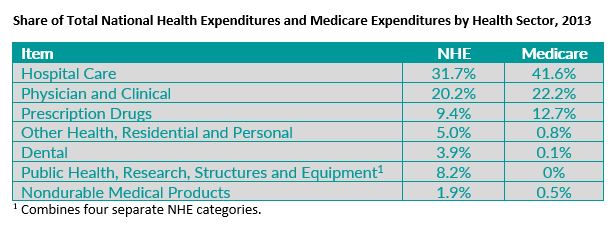
- In 2013 the NHE included $237 billion in spending on Public Health, Research, Equipment, and Structural Expenditures. Medicare is recorded as having $0 spending in these categories.
- By design Medicare paid only 0.3 percent of the nation’s $113 billion dental bill and disproportionately small shares of the nation’s (1) $145.6 billion in spending on “other health, residential and personal” services and (2) $54.8 billion in spending on nondurable medical products.
Of course, by design Medicare has very little or no spending in these categories, while NHE includes about $550 billion for them. Therefore, retail drugs and other services that are counted in Medicare automatically have a higher share of spending in Medicare than NHE. If we drop the categories listed above from NHE and Medicare to get a better comparison, a large majority of the difference between retail drugs’ share of NHE and Medicare disappears.
Additionally, it’s not surprising that the share of spending for particular health care items and services varies between Medicare and NHE, since there are likely to be differences in the types of care needed by seniors and disabled people in Medicare compared to the remainder of the population. In fact, different shares of Medicare and NHE spending by category of service are common, as shown in the table below (which hasn’t been adjusted to make NHE and Medicare more alike). In some sectors, the difference is much larger than the difference MedPAC reports for retail drugs. For example, hospitals’ share of spending is 9.9 percentage points higher in Medicare than in NHE.

Overall, MedPAC’s presentation of the data comparing retail drug spending in Medicare vs. NHE doesn’t point to any particular policy issue or conclusion. Medicare coverage is not intended to cover all of the categories counted in NHE and the very different Medicare and non-Medicare populations are likely to need and use somewhat different patterns of care.
What is actually included in Medicare spending on drugs?
There’s an additional factor to consider when assessing the MedPAC data’s implications. In my experience, policy discussions about drug spending implicitly assume all payments go to brand manufacturers. This isn’t the case. We’ll look at this more closely in a future post.
In sum, even if numbers seem to speak for themselves, they rarely do. Context matters. For MedPAC’s findings about prescription drugs, useful context includes how they fit into National Health Expenditures and Medicare as a whole and their changing role in treating disease. A framework that considers these factors is likely to reach different policy conclusions than one that omits them.
Continue to check back in with Medicare Monday or Costs in Context for more information on this topic.