New PhRMA resources chock full of biopharma industry facts
Did you know that PhRMA member companies invested $65.5 billion in research and development (R&D) in 2016?

New PhRMA resources chock full of biopharma industry facts.
Did you know that PhRMA member companies invested $65.5 billion in research and development (R&D) in 2016?
New PhRMA resources chock full of biopharma industry facts.
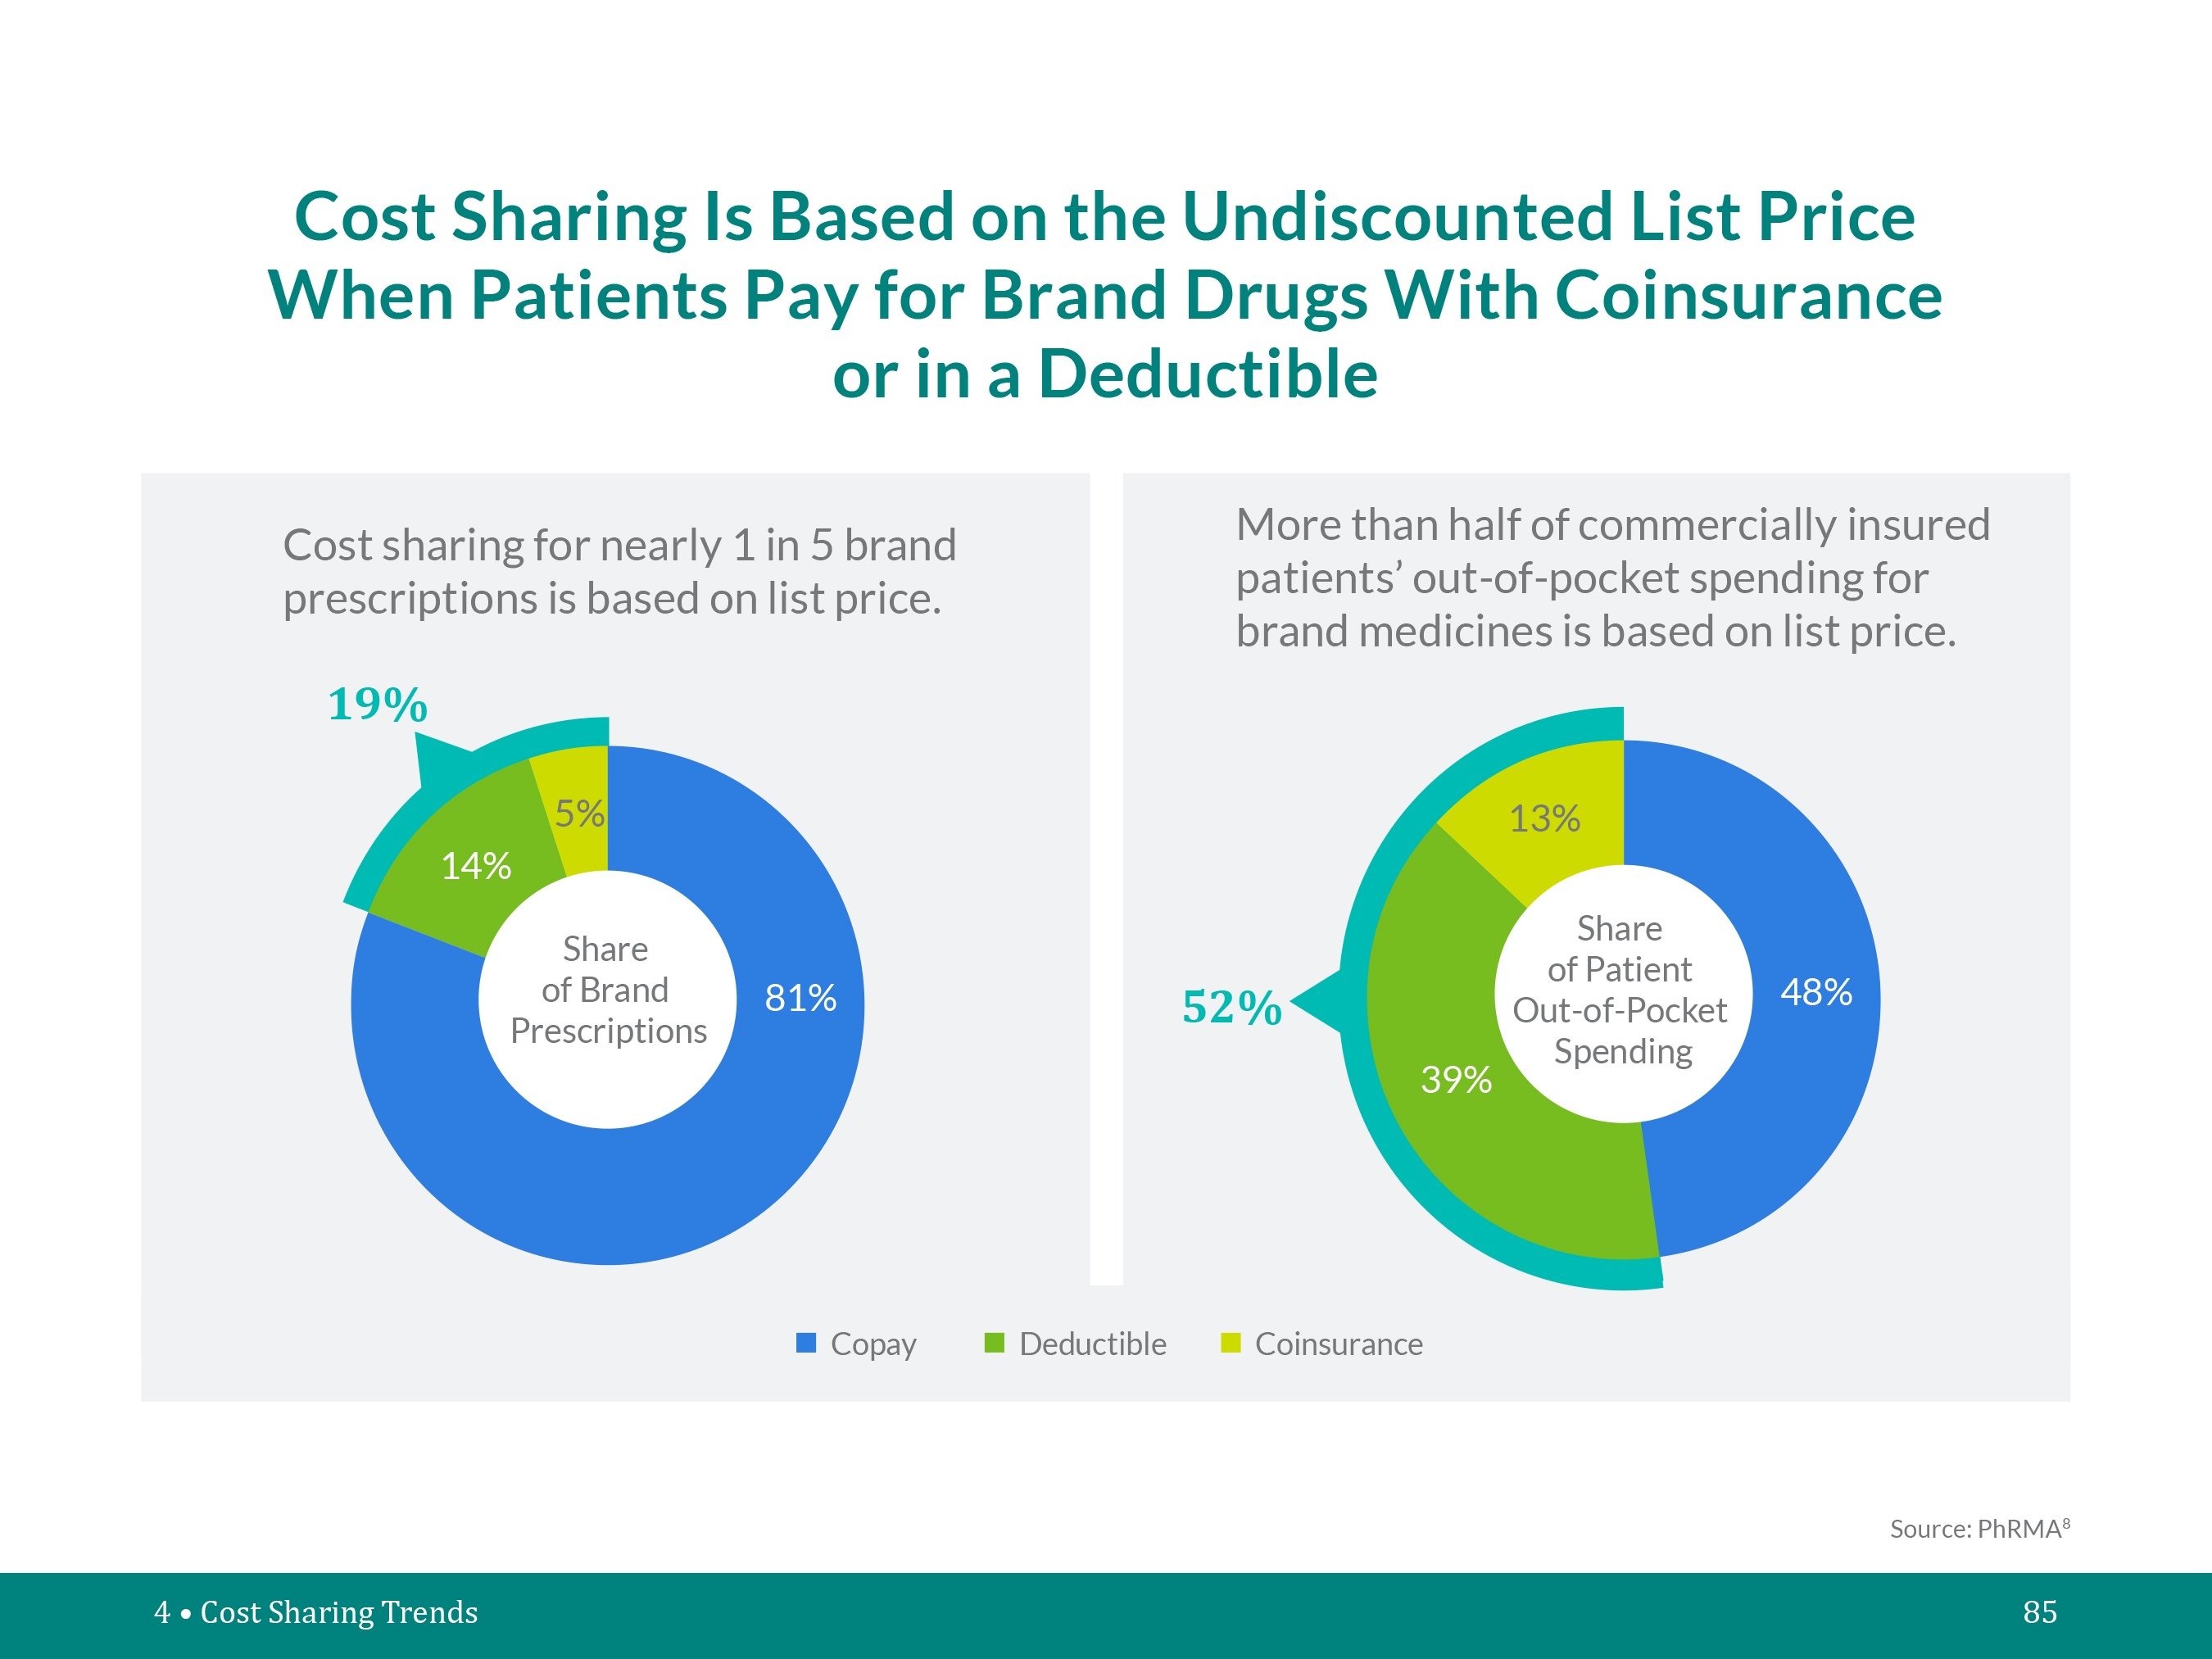
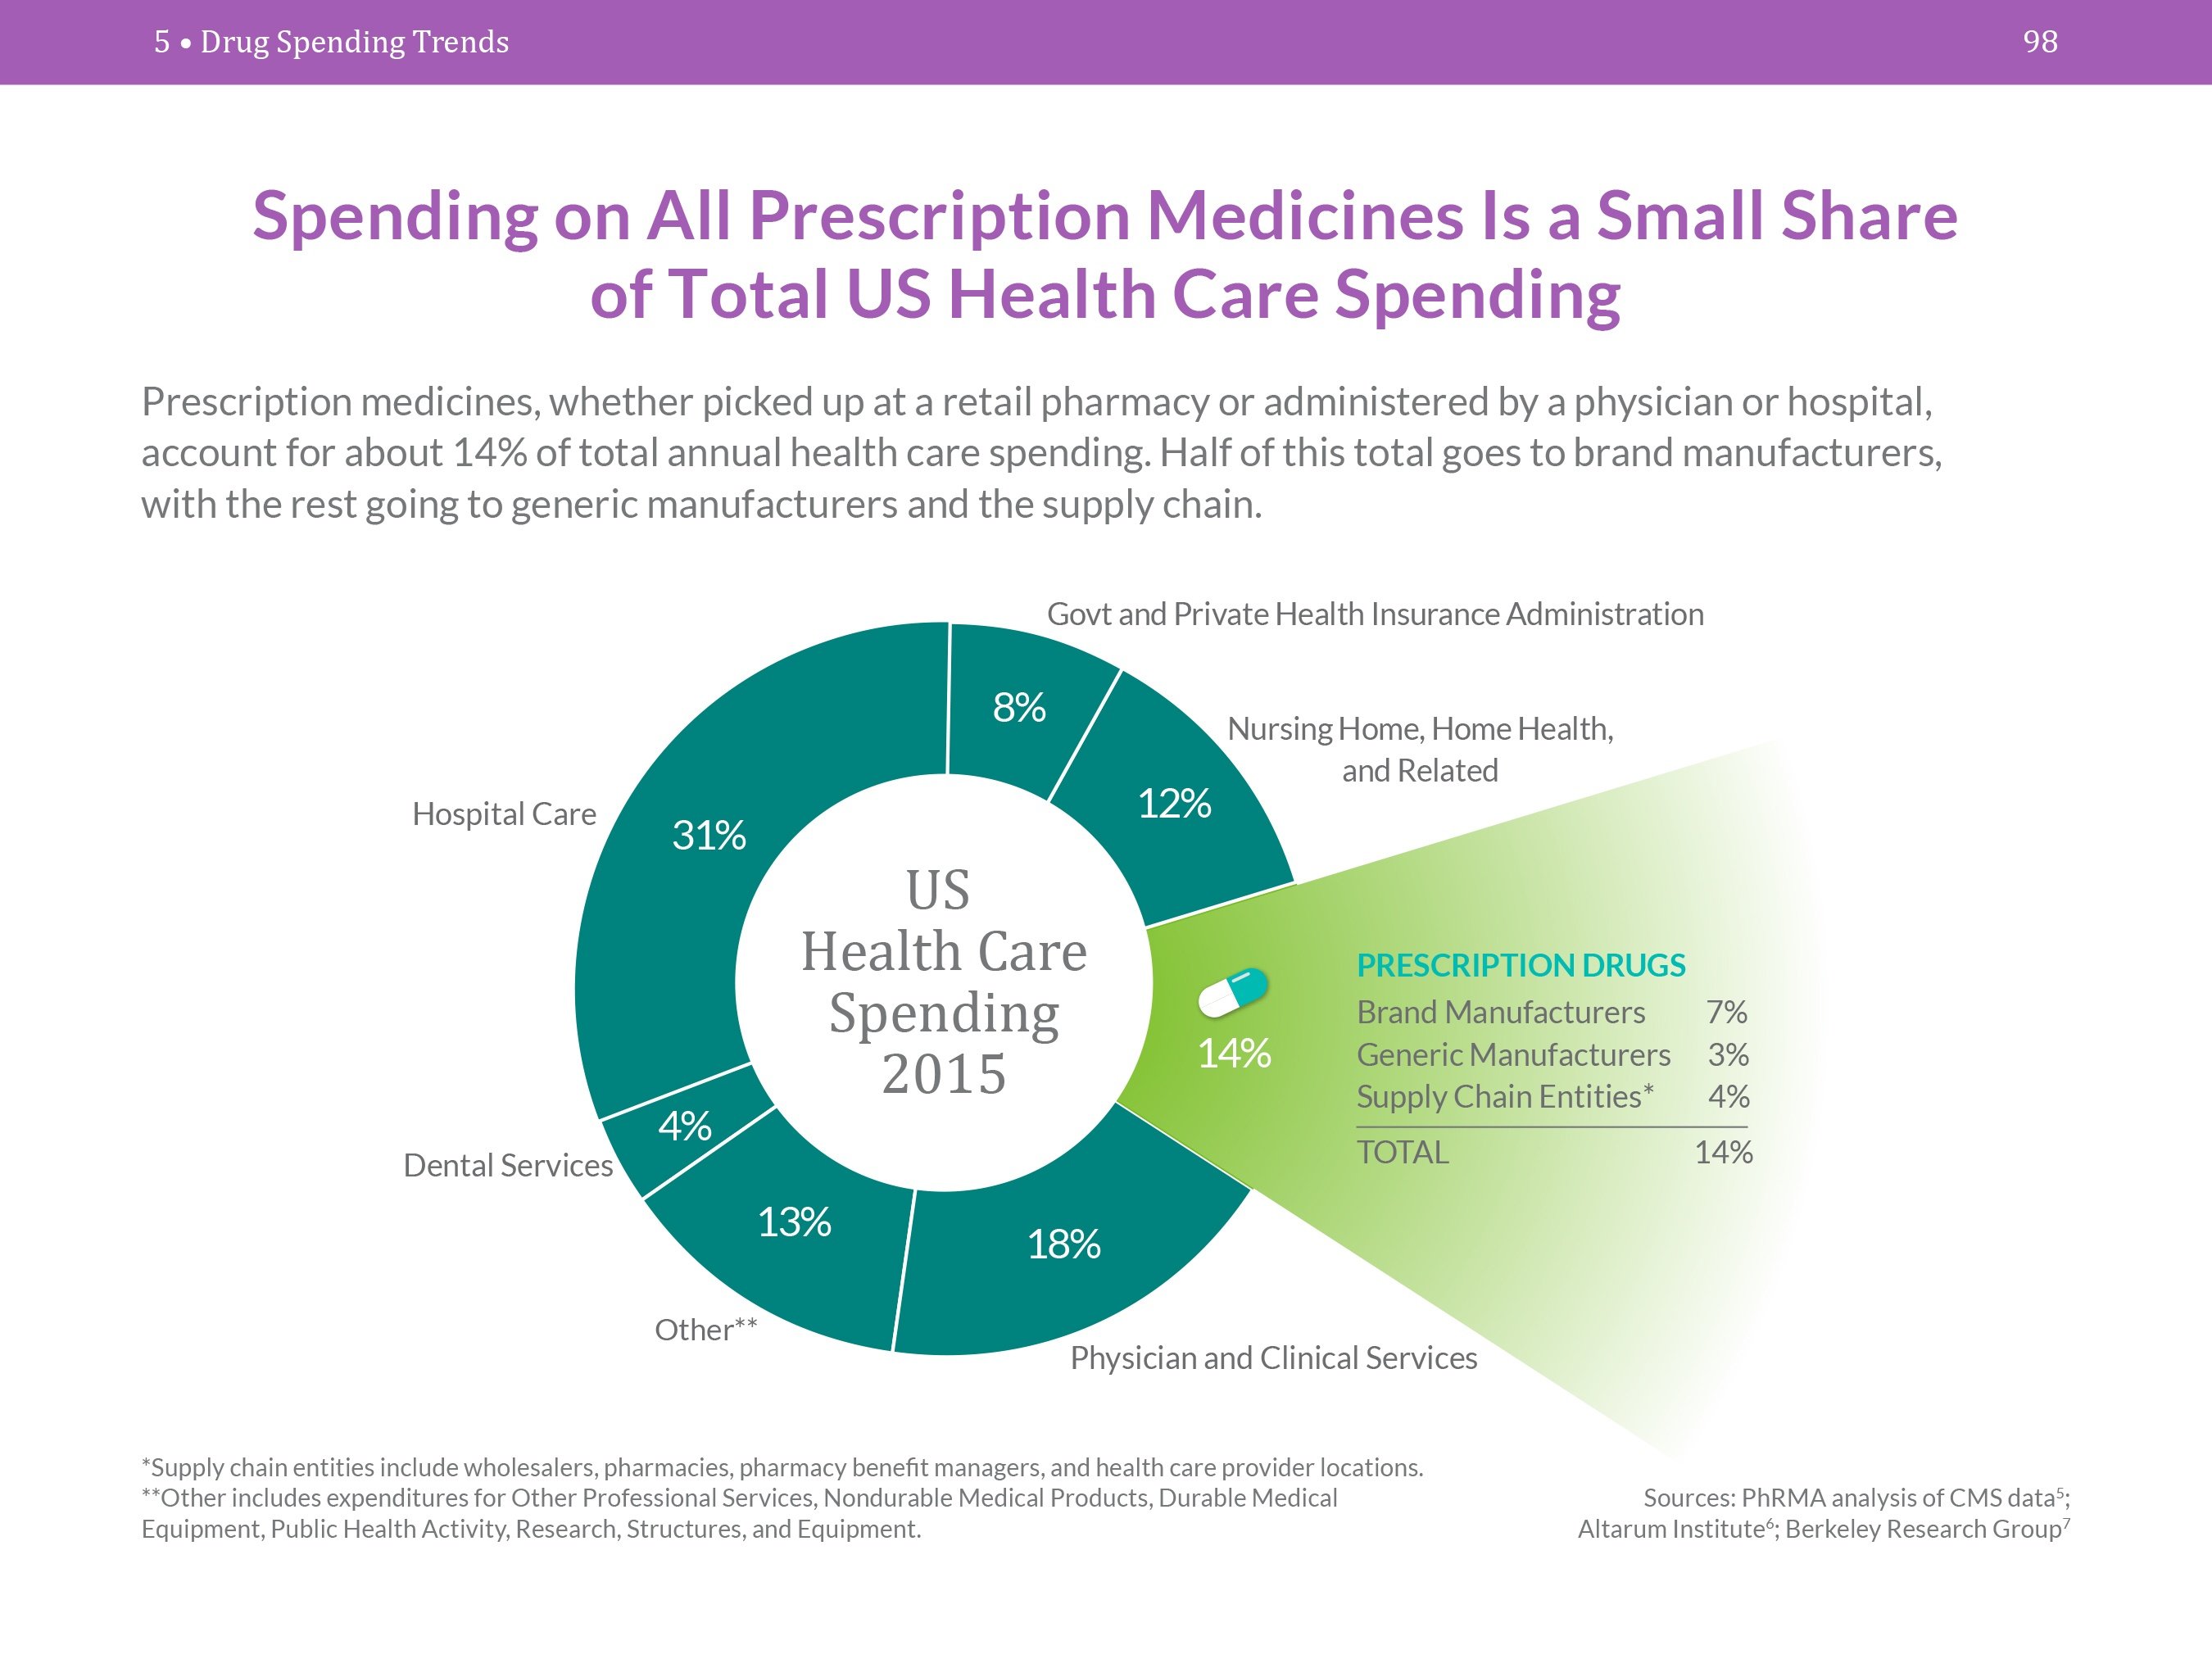
Did you know that PhRMA member companies invested $65.5 billion in research and development (R&D) in 2016? Or that combined spending on brand medicines, generics and the supply chain account for 14 percent of total national health spending, with brands accounting for just half of this (7 percent)? Or that the United States accounts for two thirds of the world’s venture capital investments in high-growth biopharmaceutical startups?
These are but a few of the facts that can be found in the 2017 Biopharmaceutical Research Industry Profile and industry chart pack, Biopharmaceuticals In Perspective released today. These annual resources share wide-ranging data points and updates on advances in treatment, research and development, market dynamics, cost sharing trends, medicine spending trends, outcomes and savings and the industry’s economic impact.
Must-know industry facts include:
Negotiated savings on brand prescriptions are often not shared with pateints who are increasingly being asked to pay more out of pocket.